2 min read
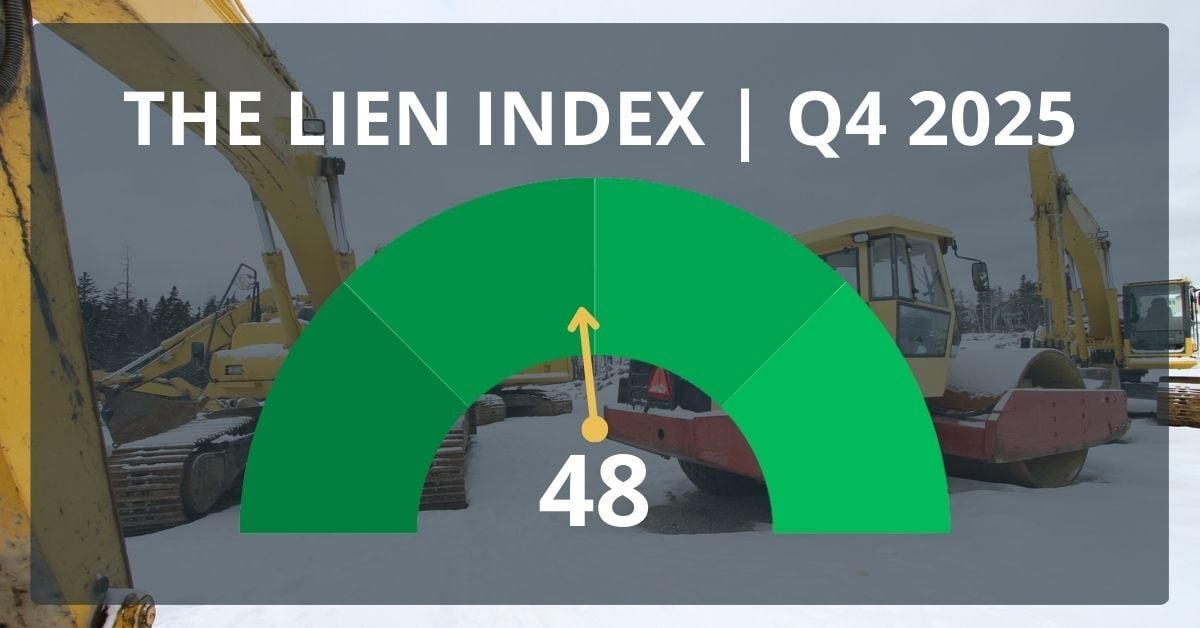
Lien Index Falls 7 Points (13%) to 48 from Revised Q3 Score of 55, Dropping Below Neutral for First Time Since Q1 2023
How to Read the Lien Index
The Lien Index measures trends in mechanic’s lien activity across the U.S. construction industry, helping contractors, suppliers, and credit professionals understand changes in payment risk and project activity.
-
0–100 Scale: 50 represents a neutral benchmark
-
Above 50: Higher levels of lien filings, often tied to increased construction volume or payment disputes
-
Below 50: Lower activity, commonly associated with slower construction starts or tighter financing
-
Quarter-over-Quarter Changes: Highlight shifts in market conditions, regional risk, and payment trends
Because mechanic’s liens are typically filed later in the construction lifecycle, the Lien Index reflects upstream project trends like architecture billings, construction starts, and contractor backlog.
Quarter-over-Quarter Lien Index Trends
The Q4 2025 Lien Index registered at 48, marking the first time since Q1 2023 that it fell below neutral (50).

This decline signals a contraction in overall mechanic’s lien activity and could reflect a broader slowdown in construction momentum.
The Q3 2025 Lien Index was revised up to 55 (from 51), making the Q4 drop more pronounced. While activity appeared stable mid-year, pressures reemerged quickly as project pipelines tightened and owners became more cautious.
 Regional Mechanic’s Lien Activity
All regions experienced quarter-over-quarter declines in lien activity:
-
South: 58, down 12%
-
Northeast: 45, down 22%
-
West: 42, down 11%
-
Midwest: 33, down 18%


The Midwest and Northeast posted the lowest scores, reflecting reduced construction volume and sensitivity to financing pressures. Even in the South, a double-digit decline shows that high-growth markets are not immune to shifting conditions.
States with Highest Mechanic’s Lien Activity
 Despite the national pullback, Texas, Florida, California, Nevada, and Georgia continue to lead the country in lien activity. These large and diverse construction markets continue to generate higher filing volumes even during slower cycles.
Top 3 States by Region
- West: California, Nevada, Colorado
- Midwest: Iowa, Ohio, Illinois
- South: Texas, Florida, Georgia
- Northeast: New York, Massachusetts, New Jersey
Industry Indicators Influencing Lien Activity in Q4 2025
Several industry indicators help explain the Q4 Lien Index decline:
-
Architecture firm billings softened in 2025, with ABI scores below growth thresholds, signaling fewer projects entering lien-triggering stages (AIA ABI)
-
Contractor backlog and confidence moderated, reflecting caution around financing and margins (ABC Backlog Indicator)
-
Construction starts and planning activity slowed, highlighting uneven demand and owner hesitancy (Dodge Construction Network Momentum Index)
-
Materials pricing volatility and tariffs continued to affect costs and timelines, pressuring margins and contributing to delayed or cautious project execution (ABC Monthly Construction Economic Survey)
These factors combined to create a slower pipeline of active projects and payment disputes, reflected in the lower Q4 score.
What the Q4 Lien Index Means for Construction Credit Risk
A lower Lien Index does not necessarily indicate healthier payment conditions. Often, it reflects fewer projects reaching lien-triggering stages and delayed starts.
Key actions for contractors and suppliers:
-
Maintain timely notices
-
Keep documentation ready
-
Apply proactive lien rights management
These steps help protect payment priority in a more competitive environment.
Looking Ahead
As the industry moves into 2026, uncertainty around interest rates, material costs, and project starts is likely to continue influencing lien activity. Indicators suggest continued volatility rather than a rapid rebound, reinforcing the importance of early risk identification and disciplined credit practices (AIA ABI; ABC).
Why the Lien Index Matters to Contractors and Suppliers
Shifts in mechanic’s lien activity reflect upstream changes in project starts, financing conditions, and owner behavior.
Benefits for contractors and suppliers:
-
Anticipate where payment pressure may rise
-
Adjust credit practices accordingly
-
Inform decisions on credit limits, contract terms, and notices
Even in slowing markets, a declining Lien Index does not eliminate risk, emphasizing the continued importance of protecting mechanic’s lien rights and maintaining complete project documentation.

Lien Index Q2 2026
Explore the latest Lien Index findings for Q2 2026, revealing trends in mechanic's lien activity and insights into construction industry credit risks.

Healthcare Bankruptcies Are Rising: A Risk to Suppliers
Healthcare bankruptcies are up 300%+ since 2010. See what unsecured creditors really recover — and how a UCC filing changes the outcome. Free download.

Full vs. Unpaid Balance Lien States Explained
Learn how full price and unpaid balance lien states affect your mechanic's lien rights as a subcontractor or supplier - and how to protect them.