5 min read
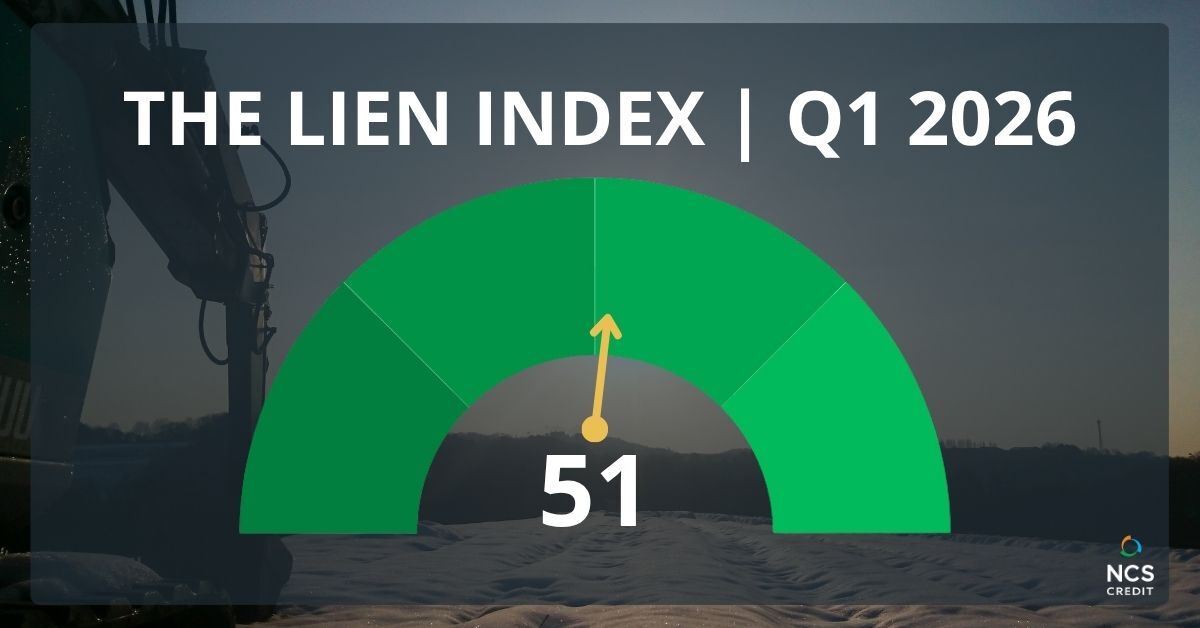
Lien Index Dips 7% to 51 from Revised Q4 Score of 55, Holding Above Neutral
How to Read the Lien Index
The NCS Credit Lien Index measures trends in mechanic's lien activity across the U.S. construction industry. A higher Index score reflects increased lien filing activity, a signal of payment stress, disputes, and financial strain across the construction supply chain. A lower score indicates decreased filing activity, which may reflect improved payment conditions, fewer projects reaching lien-triggering stages, or both.
- 0–100 Scale: 50 is the neutral benchmark
- Above 50: Increased mechanic's lien filing activity, often associated with payment disputes and elevated credit risk
- Below 50: Decreased filing activity, which may reflect fewer active projects or easing payment pressure
- A note on the data: Because mechanic's liens are filed later in the construction lifecycle, the Index reflects upstream project trends. Recording offices nationwide manage ongoing backlogs of filings, and the Index is adjusted and revised as that data becomes more complete.
National Mechanic's Lien Activity
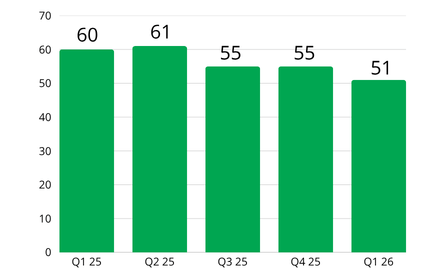
The Lien Index registered 51 in Q1 2026, a 7% decline from the revised Q4 2025 score of 55. A note on that revision: the originally published Q4 score of 48 reflected data as it stood at publication. As recording offices processed backlogs and filings became more complete, the Q4 score was revised upward to 55, consistent with the ongoing data pipeline that shapes every edition of the Index. The Q1 reading of 51 reflects the revised baseline.
Stepping back, the current score deserves some context. The Lien Index has ranged from 55 to 67 since early 2023, a sustained period of elevated lien filing activity and, by extension, elevated payment stress across the construction supply chain. Q1 2026's reading of 51 is the lowest the Index has registered since 2022, representing a meaningful normalization from that extended stretch. It's also a 17% decline compared to Q1 2025, when the Index stood at 61.
A declining Index signals fewer mechanic's liens being filed, which can reflect some combination of easing payment conditions, fewer projects reaching lien-triggering stages, and slower construction activity overall. Given what industry indicators are showing this quarter, the most likely explanation is a mix of all three, with project pipeline softening playing a significant role.
Regional Mechanic's Lien Activity
 Lien filing activity declined across all regions in Q1, consistent with the broad-based softening seen in construction industry indicators throughout the quarter.
- South: 61, down 9% from revised Q4 score of 67
- Northeast: 47, down 4% from revised Q4 score of 49
- West: 44, down 10% from revised Q4 score of 49
- Midwest: 37, flat compared to revised Q4 score of 37
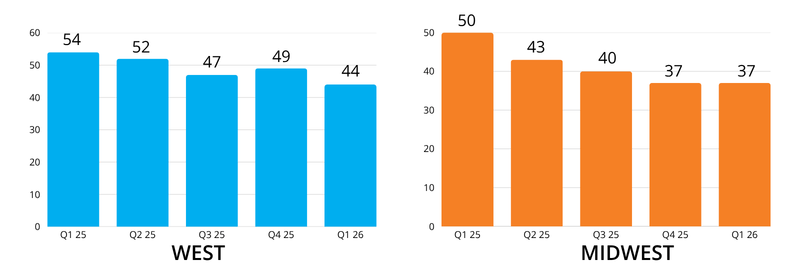
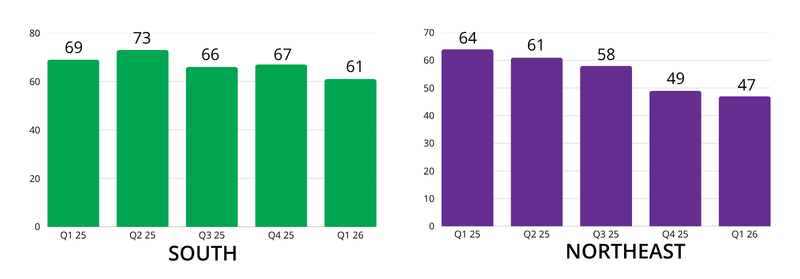
The South continues to lead the country in lien filing activity by a significant margin, though it pulled back from an elevated Q4. Sustained above-50 readings in the South reflect ongoing payment challenges in one of the country's most active construction markets. The Midwest held steady quarter-over-quarter (the only region not to decline) though it remains the lowest-scoring region nationally. The West and Northeast both sit just below neutral, with lien filing activity at its most subdued in several years.
States with Highest Mechanic's Lien Activity
The top 5 states for lien activity were (in order of volume): Texas, Florida, California, Nevada, and Georgia.
 Top 3 States by Region
- West: California, Nevada, Colorado
- Midwest: Iowa, Ohio, Illinois
- South: Texas, Florida, Georgia
- Northeast: New York, Massachusetts, New Jersey
Looking Forward
The construction industry entered 2026 on uncertain footing, and conditions grew more complicated as the quarter progressed. Architecture billings remained soft throughout January before recovering to near-flat in February, according to the AIA/Deltek Architecture Billings Index. Contractor backlog fell to a four-year low in January before recovering through February and March to finish the quarter above year-ago levels, per Associated Builders and Contractors. The Dodge Momentum Index declined in both January and February as nonresidential planning normalized following an active late 2025, before edging back up in March. The March recovery, however, was driven almost entirely by data center projects rather than broad-based demand, with meaningful acceleration in construction spending not expected until 2027.
The picture beneath those headline numbers is uneven. Data center construction continues to carry an outsized share of activity, with contractors tied to that sector carrying significantly stronger backlog than those who are not. Outside of data centers and a handful of large infrastructure projects, broad-based demand has softened. Nonresidential starts fell sharply in January, and January's modest topline growth in construction starts masked an underlying weakness: Dodge's chief economist noted that total starts would have been negative without three large nonbuilding megaprojects. Commercial and institutional pipelines have cooled, and owners across sectors are showing hesitation about committing to new projects.
Bankruptcies Continue to Climb
Epiq AACER reported that total bankruptcy filings rose 11% in calendar year 2025, and that trend accelerated into 2026, with January and February each posting double-digit year-over-year increases. Small business restructurings grew for eight consecutive months, a persistent signal of the financial pressure on the contractors and suppliers most vulnerable to payment delays and project slowdowns. Fewer lien filings do not mean fewer businesses are under strain.
Energy Prices and Geopolitical Uncertainty Add New Pressure
Late in the quarter, rising energy prices and geopolitical uncertainty introduced new headwinds. Oil and diesel costs surged, putting renewed pressure on contractor margins and borrowing costs at a moment when many firms were already operating cautiously. Whether that pressure translates into increased payment disputes and a reversal of the declining lien trend will become clearer in Q2.
The Bottom Line
A Lien Index of 51 reflects a construction market where payment stress has eased from the elevated levels of the past two years but hasn’t resolved. Fewer liens filed doesn’t mean fewer projects at risk. Serve preliminary notices and secure mechanic's liens and bond claims on every construction project. File UCCs on every customer with an open line of credit. The conditions that put contractors and suppliers in financial jeopardy have not disappeared… they have shifted.
Industry Experts
The AIA/Deltek Architecture Billings Index (ABI) reported softening conditions to start the year, with January's score dropping to 43.8 before recovering to near-flat territory in February at 49.4. Inquiries into new projects increased for the second consecutive month in February, and while the value of newly signed design contracts continued to decline, the pace of that decline slowed. AIA noted that these signs suggest business conditions at architecture firms may be stabilizing, "though ongoing global economic uncertainty may make that short-lived." Firms across all specializations continued to experience declining billings through the quarter, with the Northeast particularly affected by winter storms.
Associated Builders and Contractors (ABC) reported a quarter that started soft but finished on firmer footing. The Construction Backlog Indicator fell to a four-year low in January before rebounding to 8.1 months in February and climbing further to 8.6 months in March, the strongest reading since last summer and, notably, above year-ago levels. All three components of ABC's Construction Confidence Index finished the quarter above 50 and above their year-ago readings, indicating broad expectations for growth over the next six months. The data center divide remained pronounced: contractors working on data centers reported backlog of 10.6 months in March compared to 8.3 months for those who are not. "Backlog has fully rebounded from January's four-year low and, at 8.6 months, is now back to levels not seen since last summer," said ABC Chief Economist Anirban Basu. ABC also noted that rising energy prices and geopolitical uncertainty pose ongoing risks to contractor margins heading into Q2.
Dodge Construction Network reported that the Dodge Momentum Index declined in both January (down 6%) and February (down 7%) before edging up 2% in March, completing a full quarter of data. The March gain, however, was powered almost entirely by data center projects, with most other commercial and institutional sectors pulling back. As Sarah Martin, Associate Director of Forecasting at Dodge Construction Network, put it: "For some categories, this reflects a natural reset after the outsized growth in late 2025. But for others, elevated macroeconomic risks are likely beginning to feed into planning decisions." Year-over-year, the Index remained up 25.8% as of March, though strip out data centers and the commercial segment was actually down 12.7% over the same period. Construction starts grew just 1% in January before slowing 13% in February, with the topline figures in both months obscuring broad weakness across nonresidential and residential sectors.
Epiq Bankruptcy reported that total U.S. bankruptcy filings rose 11% in calendar year 2025 and continued accelerating into 2026, with January filings up 10% and February up 14% year-over-year. Small business filings, captured as Subchapter V elections within Chapter 11, have grown for eight consecutive months, surging 91% in February compared to the prior year. "The significant increases in Subchapter V elections reflect the reality that many small businesses are operating in a challenging environment with higher borrowing costs, softening client demand, and tighter lending standards," said Michael Hunter, Vice President of Epiq AACER.
*Nationwide, recording offices manage a backlog of requests. The Index data is adjusted and revised accordingly. The Q4 2025 Lien Index score was revised from 48 to 55 as additional filing data became available.

Lien Index Q2 2026
Explore the latest Lien Index findings for Q2 2026, revealing trends in mechanic's lien activity and insights into construction industry credit risks.

Healthcare Bankruptcies Are Rising: A Risk to Suppliers
Healthcare bankruptcies are up 300%+ since 2010. See what unsecured creditors really recover — and how a UCC filing changes the outcome. Free download.

Full vs. Unpaid Balance Lien States Explained
Learn how full price and unpaid balance lien states affect your mechanic's lien rights as a subcontractor or supplier - and how to protect them.